Adsorption of Gas
Carbon Nanotubes show strong adsorption to gaseous molecules like nitrogen dioxide [162][163], carbon monoxide, ethylene [163], ammonia [162][164][161], oxygen [165][166], noble gases [167][168], methane, or molecular nitrogen [168] and have therefore been discussed for their usage as gas sensors. The advantage of carbon nanotubes over commonly used sensors is that they can be operated at room temperature, do not corrode, and - due to their confined structure - offer large surface areas for the adsorption of molecules with good coverage percentages and high response speed.
In addition to its use for sensors, the same adsorption has been demonstrated to be applicable for non-volatile optical memory [169]. Even though there are better materials for this purpose, carbon nanotube-based systems offer state stability over long time-scales without continuously applied voltage and stepwise intensity changes that are ideal for storing bitwise information in a nanometer-scaled system.
Their binding mechanisms generally differentiate two types of adsorption. The dispersion interaction of carbon nanotubes with different molecules allows strong physisorption of water or ethanol. These molecules can reversibly be released by lowering the pressure [170] or increasing the temperature [169].
The high amount of double bonds in carbon nanotubes allows various chemical functionalizations [171][172][173][174]. If these reactions are completely reversible without damaging the carbon network, the process is called chemisorption. The saturation of C=C double bonds using hydrogen was proven to be reversible at temperatures of 600℃ [19] and can, therefore, be considered a chemisorption process even though permanent damage to the nanotubes was also reported.
In the following, I will discuss the release of the physisorbed layer that is inherently present if carbon nanotubes are investigated in air. I will also discuss the influence of chemisorbed hydrogen to the excitonic emission.
Adsorption of Water
Carbon Nanotubes not kept under a protective atmosphere, contain a shell of adsorbates on their surface. Right after carbon nanotubes are synthesized, they are statically charged, which favors the adsorption of various adatoms. In air, this layer is usually considered to consist of water [100]. It is also reasonable to assume a layer of argon or molecular nitrogen that adsorbs directly after synthesis as such atoms are known to show similar adsorption as water [175]. However, it is not of too much relevance for my experiments what molecules this layer is composed of exactly but rather how it influences the experiments and how it can be successfully removed not to act disturbing.
All experiments were carried out under the usual oxygen-containing atmosphere. A continuous degeneration of the nanotube surface due to the reaction with adsorbed oxygen is possible at any point.[147] Therefore, the excitation power was kept at around 3-7µW (25nm bandpass) to reduce the irreversible introduction of oxygen defects. The chosen power is at least one order of magnitude lower than in other similar experiments. Because of this defect generation experiments with suspended nanotubes are usually carried out under a protective nitrogen environment.[169] The irreversible degeneration of the emission due to oxygen defects will therefore always have to be considered during the following investigations.
Total Energy Shift
In vacuum, excitons in Carbon nanotubes are influenced by an intrinsic
dielectric filling around 70% of the inner cylindric volume of the nanotube
with  and a dielectric medium surrounding
the nanotube with
and a dielectric medium surrounding
the nanotube with  [100]. Gas
adsorptions on a clean surface induce a change in this outer dielectric
environment. This change in the dielectric constant influences the prefactor of
the Coulomb energy and causes a shift of the excitonic emission energy to the
red.[176] Changes in the cylindric dielectric surrounding can be
calculated using approximations to the Bethe-Salpeter equation.[177] They are found to cause a modification of the excitonic
binding strength
[100]. Gas
adsorptions on a clean surface induce a change in this outer dielectric
environment. This change in the dielectric constant influences the prefactor of
the Coulomb energy and causes a shift of the excitonic emission energy to the
red.[176] Changes in the cylindric dielectric surrounding can be
calculated using approximations to the Bethe-Salpeter equation.[177] They are found to cause a modification of the excitonic
binding strength  in the system by
 and scale inversely with the
diameter d of the nanotube.[178] Thus, by observing the
excitonic excitation and emission energies, it is possible to detect changes in
the dielectric environment.
and scale inversely with the
diameter d of the nanotube.[178] Thus, by observing the
excitonic excitation and emission energies, it is possible to detect changes in
the dielectric environment.
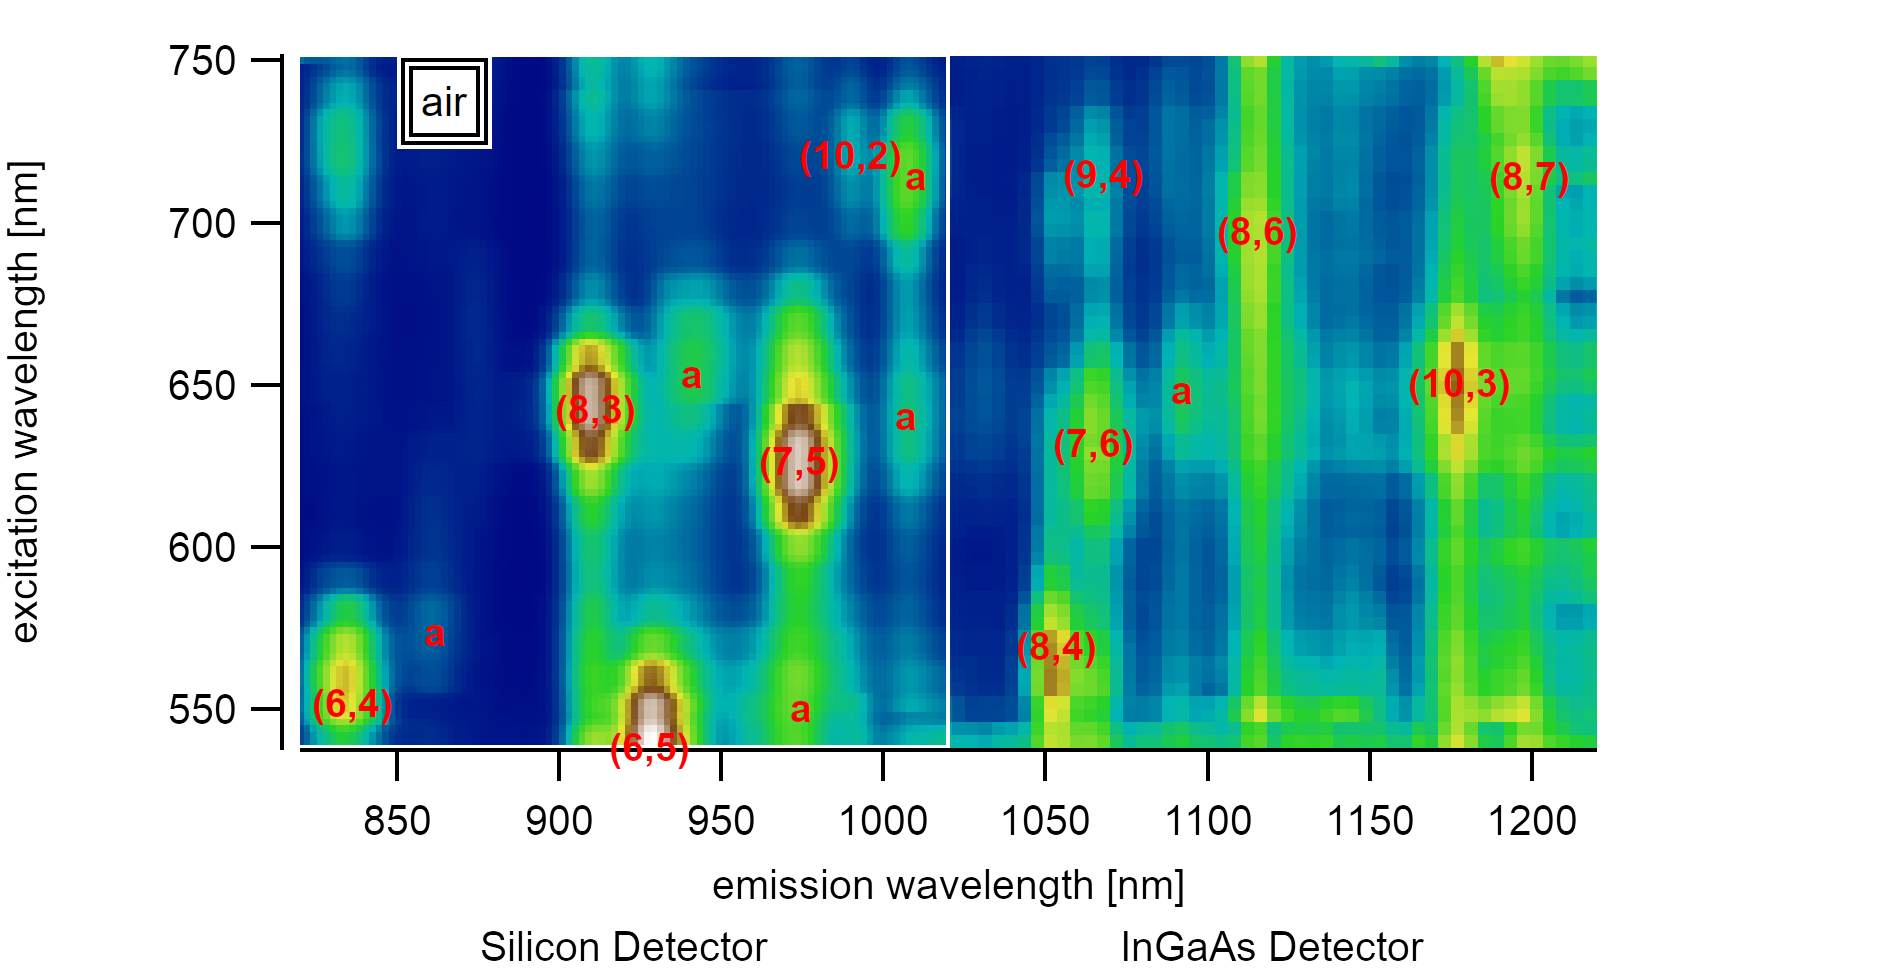
A variance spectrum shows the squared deviation of the spectral intensity of 350 PLE maps from the mean value. Adsorbed satellite peaks are marked with a.
Analyzing a sufficiently large set of suspended carbon nanotubes consisting of chiralities with different diameters, it becomes evident that there are satellite peaks slightly red-shifted to the emission from the first and second excitonic subbands. These emissions each originate from a distinct PLE map that shows resonance to a specific excitation/emission energy, unlike every other nanotube. The existence of this second type of nanotubes made the identification of air suspended nanotubes difficult if only a small number of spectra is considered. On better datasets with over 350 good PLE maps in the range between 830-1250nm, however, the satellite peaks can be identified to follow a specific pattern. While carbon nanotubes with larger diameters like the (7,6) type show small shifts of 25meV, nanotubes with smaller diameters like the (8,3) type show much higher shifts of up to 65meV. The shift can be interpreted to depend inversely on the diameter, but the dataset size (consisting of 6 chiralities) is too low to make assumptions about the curve form. The energy shift can be explained by the lowered exciton binding energy after the introduction of adatoms. To facilitate a more visual model, the diameter dependence could be caused by the higher penetration of excitonic electrical field lines into the dielectric surrounding.
Adsorbed water is known to cause shifts of 25meV for E₁₁, and 47meV for E₂₂ [170]. These changes are proportional to the inverse energy and are therefore sometimes given on a wavelength scale as 34nm for E₁₁ and 23nm for E₂₂ [179]. The discrepancy of the energy-difference between ΔE₂₂ and ΔE₁₁ was also found for aerogel dispersed [180] surfactant-free nanotubes and could be explained through stress and strain effects [181] caused by the surfactants. It is reasonable to assume that the overall shift strongly depends on the coverage percentage and the reference of the clean surface in vacuum. The measured adsorbed energies in air are in good agreement with suspended nanotubes reported by Liu et al.[41]. In their analysis, the PLE absorption of the (7,5) type to E₂₂ is located at 1.94eV (640nm), and the emission is at 1.23eV (1008nm). This energy is roughly the same as found here (640.5nm and 1007nm) but clearly shows that these suspended nanotubes also had a water layer adsorbed during the measurement. Measurements in air often do not account for this layer [159], which causes successive flaws. Energy comparisons in newer studies are mostly aware of this adsorption effect.
The investigations by Miauchi et al. [159] were focussed on SWIR active carbon nanotubes with diameters above 0.9nm where the changes to the energy were found to be nearly constant for all chiralities. This study concentrates on the silicon-active nanotubes with diameters below 0.9nm. If the exciton size is approximated to stay constant for different diameters, changes in the outer dielectric become more substantial for smaller diameters as their penetration into the medium is more substantial than for larger diameters. Although data for the (6,4) and (9,1) type are at the lower edges of the detectable range, a diameter dependence is visible. However, for some larger chiralities with diameters above 1nm, the statistical spread of ±10nm for the excitonic peak in the investigated PLE maps does not allow us to differentiate between adsorbed and desorbed states. To fully describe this behavior in more detail, the experiment needs to be performed in a defined environment where the switch between gas adsorption and vacuum is possible. Besides, the measurement range needs to be extended to allow recording more significant data for diameters above 1nm and below 0.7nm. However, the advantages of an investigation of smaller diameters were shown in this analysis.
label |
chirality |
excitation [nm] |
emission [nm] |
error (exc) [nm] |
error (emi) [nm] |
|---|---|---|---|---|---|
a |
(6,4) |
552 |
836 |
15.5 |
13.5 |
a↓ |
720 |
832.5 |
13 |
10.5 |
|
b |
(8,3) |
642.5 |
911 |
19.5 |
9.5 |
b↑ |
561 |
912.5 |
19 |
10.5 |
|
b↓ |
741.5 |
910 |
12.5 |
15 |
|
c |
(6,5) |
538.5 |
927.5 |
10 |
13 |
c↓ |
755.5 |
930.5 |
10.5 |
12 |
|
d |
(7,5) |
626.5 |
974 |
11.5 |
9.5 |
d↓ |
740 |
973 |
10.5 |
12.5 |
|
e |
(10,2) |
721 |
989.5 |
17 |
14 |
f |
(8,4) |
569.5 |
1053 |
13.5 |
6 |
g |
(7,6) |
632 |
1064.5 |
7 |
7 |
i |
(8,6) |
697.5 |
1115 |
11 |
15 |
i↑ |
644.5 |
1116.5 |
40.5 |
18.5 |
|
j |
(10,3) |
650.5 |
1177.5 |
14 |
15 |
k |
(8,7) |
714.5 |
1199 |
31 |
18.5 |
m |
(9,4) |
715 |
1067.5 |
3.5 |
15 |
↙a |
a |
574 |
861.5 |
9.5 |
2 |
↙b |
a |
653.5 |
941 |
12.5 |
10 |
↙c |
a |
550.5 |
974.5 |
23.5 |
31 |
↙d |
a |
640.5 |
1007 |
9 |
13 |
↙e |
a |
714.5 |
1010 |
18.5 |
13.5 |
↙g |
a |
648.5 |
1092 |
7.5 |
13.5 |

Carbon Nanotube photoluminescence-excitation resonances for different chiralities in the observed range. This map allows better identification of air-suspended carbon nanotubes that are adsorbed by a water layer.
Stepwise Energy Shift
One advantage of having nanotubes fixated on a substrate is that while keeping the emission of a specific nanotube in focus, the direct observation of ad- and desorption of single molecules is feasible. A rapid but continuous shift of the energy to the blue [182][169] followed by a much slower shift to the red is generally observed during heating of nanotubes with adsorbed surfaces [175]. With the results outlined above, a total shift of up to 50nm for smaller diameters should be observable if complete desorption is possible in air using laser irradiation solely to increase the heat on the sample.
Recent studies by Uda et al. have shown that the rapidness of this desorption step can be increased by de-tuning the initial E₂₂ absorption to induce an increased resonance during the desorption.[169] This also means that the heating efficiency usually has to take the absorption cross-section into account.
Therefore, to investigate the desorption process of the water layer in small steps, an excitation into the upper K-phonon sideband of the E₂₂ level was chosen, and the emission from the first excitonic subband was continuously observed over two hours.
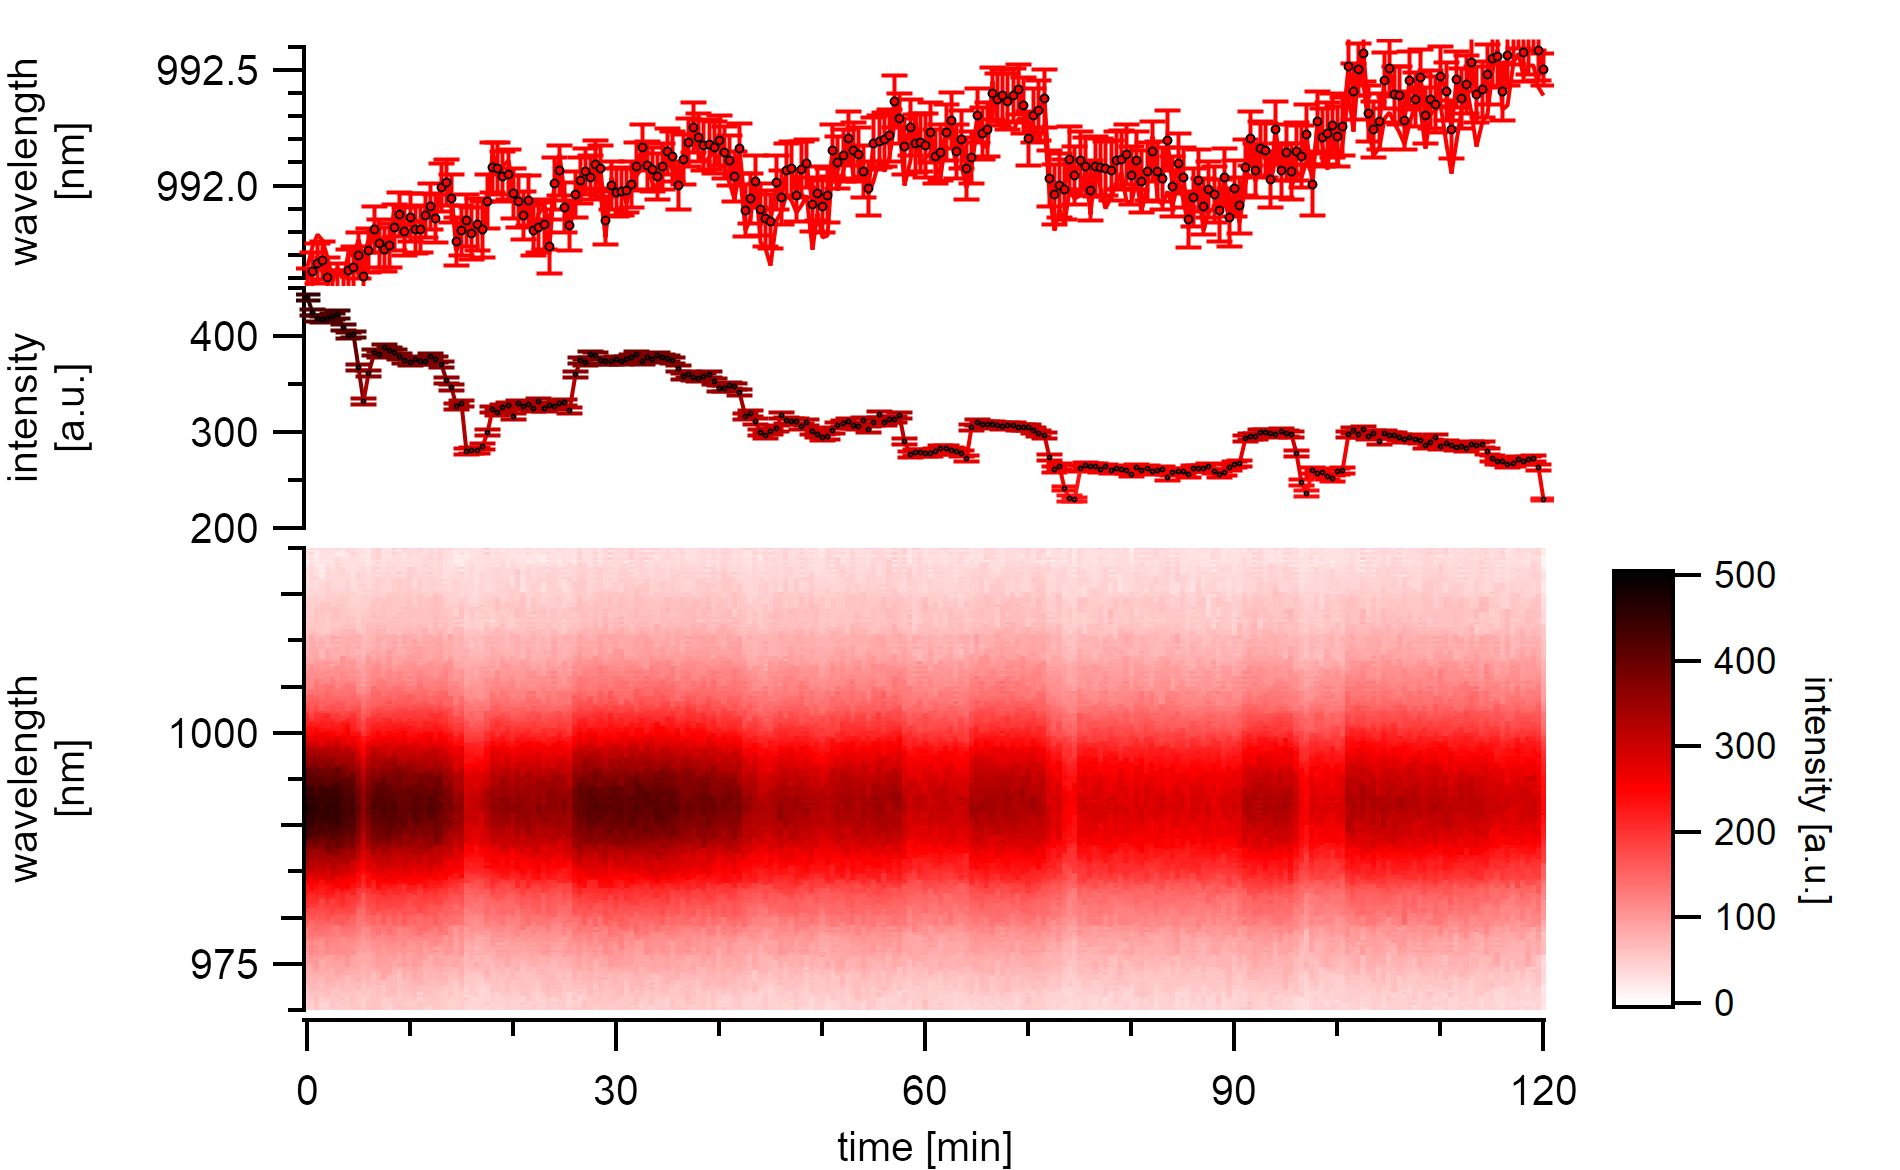
A (7,5)a type with high emission intensity undergoes continuous stepwise bleaching in air. Changes in emission energy mostly follow the stepwise bleach but also show an underlying continuous redshift.
The (7,5) type in this experiment is excited at 570nm with a power of 7µW at the sample. The reasonably high reversible steps reduce the emission intensity by 10%. In between these large drops, there are drops of around 3% visible that indicate the formation of quenching centers in the close neighborhood of already existing quenching sites. A simple approximation for these 2µm long carbon nanotube suggests that the steps originate from large segments of around 200nm that desorb from the surface. Each shift correlates with an energy shift of around 0.5nm. The newly freed surface area is open for further adsorptions making the process fully reversible. The resolution for detecting small gaseous molecules is limited by the considerably long diffusion length, which was estimated to be more than 350nm in these systems.
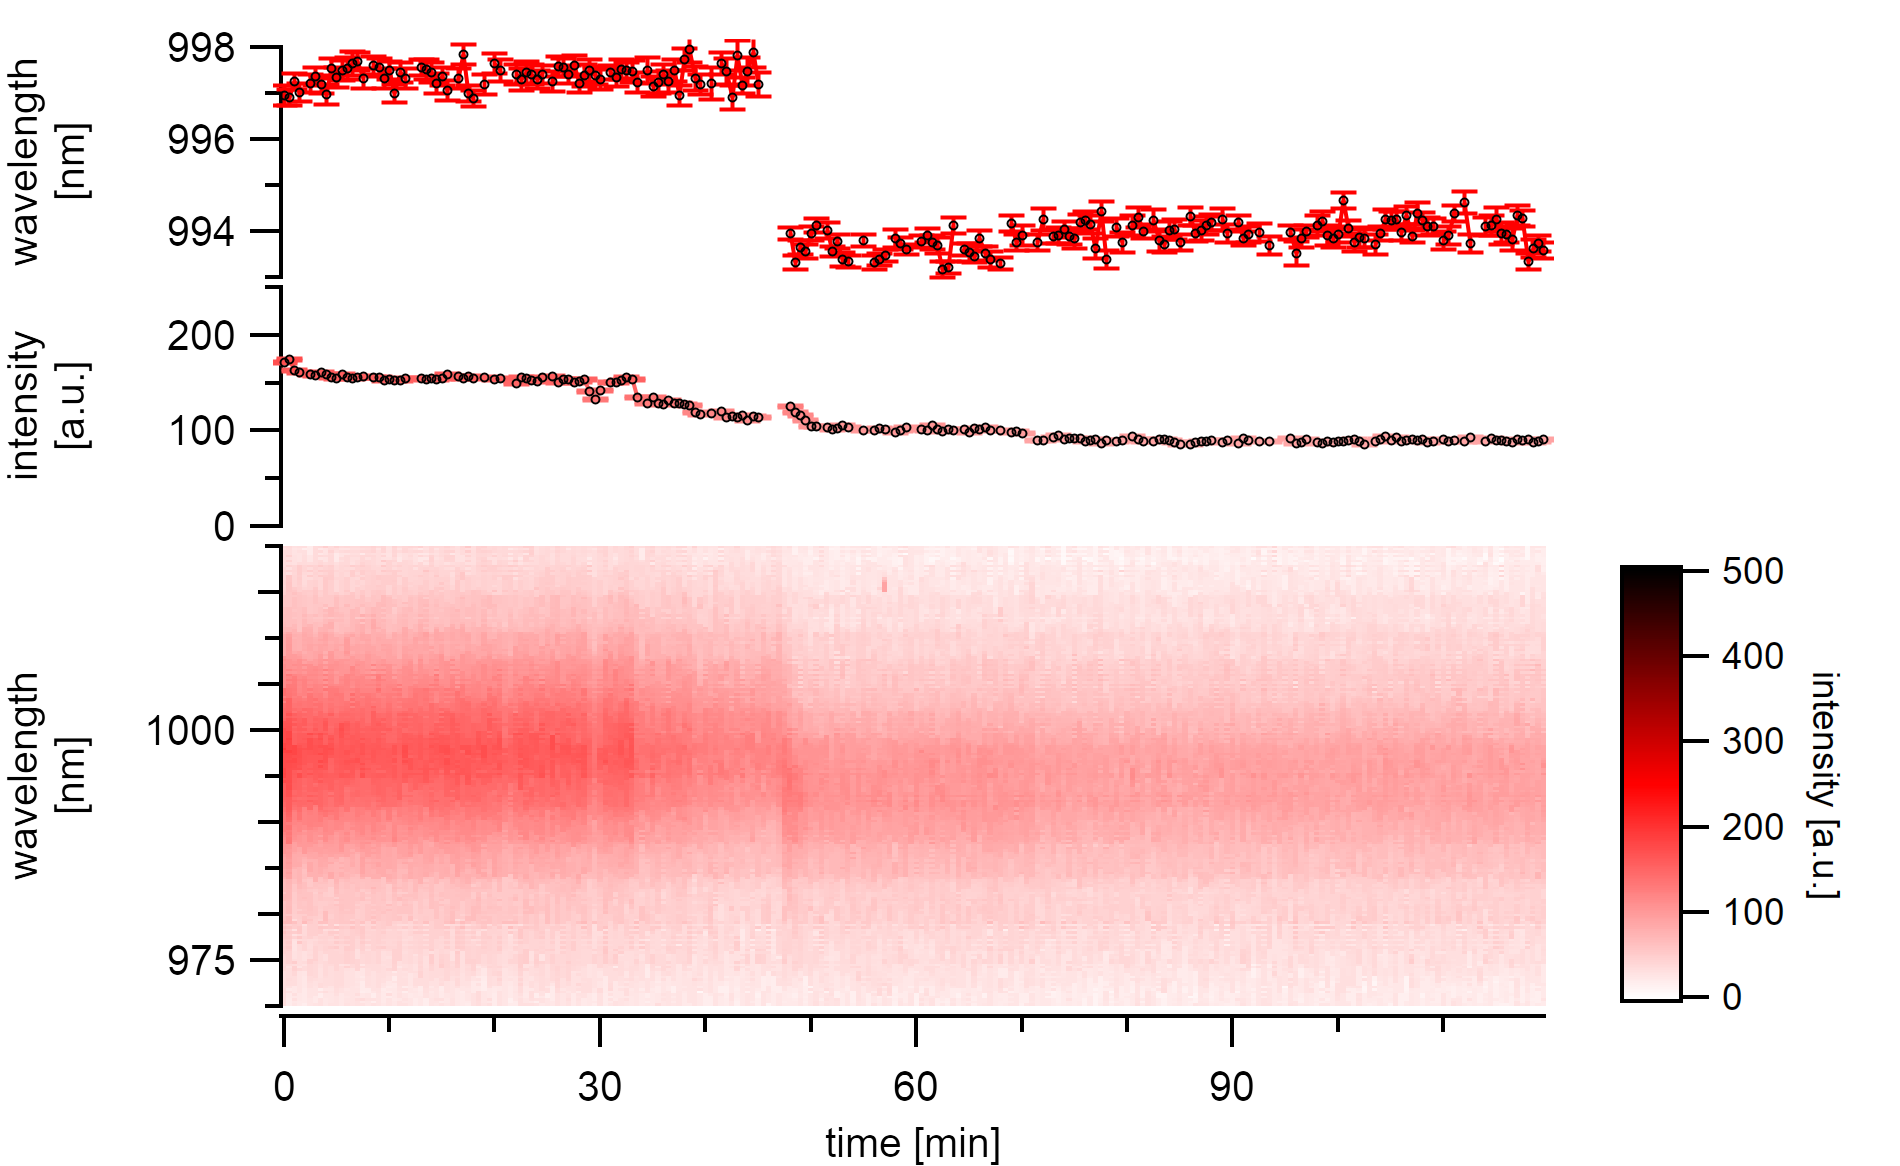
A (7,5)a type whose emission is shifting towards the energy of its desorbed state. The spontaneous shift is about 3nm to the blue and occurs within less than 30s
A type of desorption with a cooperative desorption mechanism is also visible. After the slow desorption of at least three segments of adatoms from the surface without any changes to the emission energy, a swift shift of 3nm is observable. After this shift, the nanotube is still adsorbed with molecules judging from its usual vacuum emission wavelength and the successive steps that occur even after the energy shift. The intensity bleaching continues until around 40% of the initial emission intensity is lost. After that, no step-wise decreases are visible anymore, and at this point, the emission energy also stabilizes.
Finnie et al. proposed a critical adsorbate coverage that is necessary to induce a shift.[175] Such findings are in agreement with the described stepwise intensity decrease before the blue-shift. The fact that the time series steps do not correlate with the energy before this shift suggest that the gas molecules do only desorb from the surface unto as far as necessary to release the exciton traps. The adatoms are still bound to each other, keeping the dielectric environment in a close distance from the surface intact. The complete release of this cluster finally causes a spontaneous and good resolvable change in emission energy.
Gas adsorption and desorption were studied into detail by Uda et al.[169]: The overall shift in emission energy was estimated to be around 25meV at excitations of 500µW. This gas desorption was found to be reversible in a protective gas environment, and adsorptions could get triggered by lowering the laser excitation power.
The energy shifts in these experiments were found to be mostly smaller than 5meV for the given wavelengths. These small shifts show that the rapid process may consist of step-wise desorption that indicates that the desorption is very slow, and the surface was still covered with gas molecules in these experiments. It may also indicate that the defect generation, which induces contrary shifts, curtains the overall shift. It is notable, though, that the same quick resonant sweep of the emission energy to the blue as described in literature is observed as the last identifiable emission feature indicating the state where all molecules are desorbed from the surface.

Two desorption mechanisms can be differentiated: Type I is stepwise desorption with a coverage length far below the resolvable limit, which is given by the exciton diffusion length. Type II follows a cooperative mechanism with coverages in the range of the exciton diffusion length.
The reversible step-wise change in emission intensity is explained by the reversible ad- and desorption of a water layer. The findings suggest that the change in the dielectric environment and the step-wise intensity drops originate from the same desorption process. However, the steps during this process can originate from a correlated (Type I), or a cooperative (Type II) mechanism. After the surface has been thoroughly cleaned from adsorbed molecules, the emission stabilizes in energy and intensity as no further desorption processes are possible. This point is considered to be the adsorption equilibrium at the given temperature, with the outer dielectric constant approaching 1.
Adsorption In Air
Given that the excitation power is low enough (3µW), neither intensity drops nor substantial energy changes are observed over the same measurement time. Instead, light but continuous red-shifting of the emission center by 0.25nm/h is observed while the intensity stays nearly at the same level. Following the explanation of laser-induced heat, this may indicate the slow adsorption of a water layer.
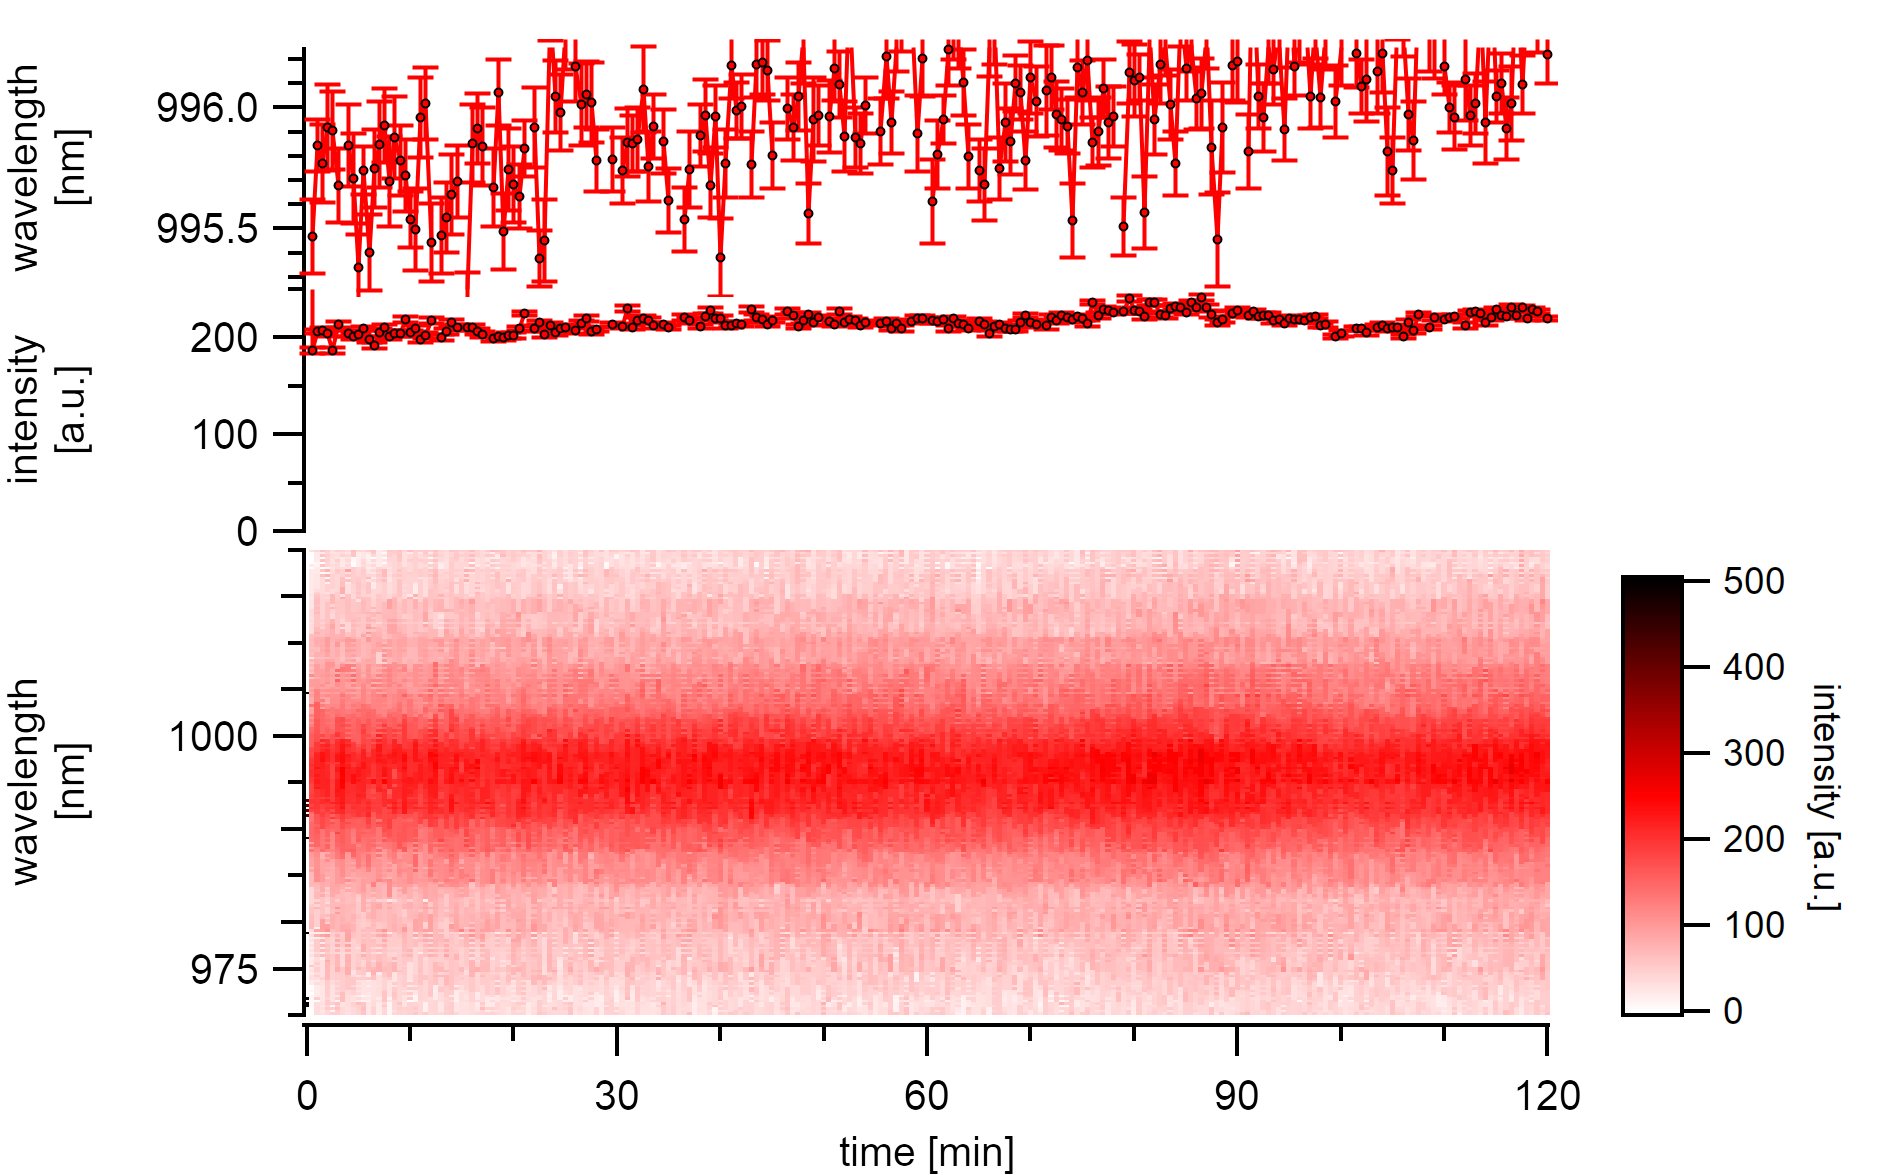
A (7,5)a type excited below 3µW is stable in its emission intensity over two hours. The emission energy changes slowly but steady to the red.
The influence of heating from the laser excitation can be proven with a simple experiment. The laser is moved along the trench, 5µm around the central position of a suspended nanotube. Spectral shifts of the excitonic emission energy become visible that increase to their highest energy as the laser spot hits the position of the emitting suspended nanotube. These spectral shifts happen within the first 6s of the initial excitation and are only visible if the setup is perfectly aligned (250 cts/s/nm). A gaussian peak fit over this emission shows a fundamental shift of 1-4nm to lower wavelength, followed by a relaxation of up to 4nm to a higher wavelength. The fixed nanotube location and the moving laser focus are taken to estimate the power uptake for each spectrum. At the chosen excitation bandpass of 550-725nm, the power of the laser spot on the sample is 250µW with a diameter (1/e) of 2µm. Assuming a homogeneous spectral weight over the excitation range, the spectral absorption of the nanotube is estimated to be below 30µW and, therefore, in the linear range. Assuming that the spectra were recorded in the linear range allows for centering the maximum emission intensity of the nanotube (displayed as heat-map colors in the graph) to the intensity profile of the laser.

The central emission wavelength shifts to the blue as the laser reaches the position of the nanotube. After removing the laser spot from the nanotube, the energy maximum shifts back to the red, indicating a reversible process.
Laser-induced heat is responsible for an increased temperature on the sample. Such changes in the available thermodynamic energy leads to reversible desorption and adsorption of the water layer in air. The process is fully reversible and typically happens within a few seconds for high excitation powers.
Conclusion
The adsorption of gas molecules takes place readily after the samples are taken out of the CVD reaction chamber and are inherent to all experiments in air. The laser can thermally heat these adsorbed molecules, eventually overcoming the adsorption energy potential leading to step-wise desorption of these gas molecules. This desorption induces changes in the dielectric environment around the nanotube that cause a blue-shift of the excitonic emission energy.
The rapid blue shift was observed in more detail and is expected to originate from the desorption of large clusters of adatoms from the nanotube surface. These clusters are expected to extend over a few hundred nanometers along the nanotube.
Adsorption of Hydrogen
Chemisorbed hydrogen creates sp³ defects in the carbon lattice. Calculations using density functional theory show that a high amount of hydrogen chemisorption with coverage values of 50-100% [183] is possible by saturating the C=C double bonds. This chemisorption was proven to be reversible at high temperatures of 600℃ [19]. These defects show emission at lower energies than the emission of the E₁₁ exciton.[184]
The defined introduction of defects to the carbon lattice is vital for various applications. In biological tissues defect states can be used to achieve better image contrast by efficiently reaching different NIR regions for excitation and emission with higher transparency than in the visible range.[15] In addition, single-wall carbon nanotubes have shown photon anti-bunching [12] in the wavelength range for fiber optic communications which enables their usage as single-photon emitters. However, carbon nanotubes exhibit a relatively low quantum yield of 1% from various non-radiative exciton decay channels. The localization of excitons at defect sites is able to increase the quantum yield [149] which has been shown to also be usable for photon antibunching [16]. Carbon nanotube-based light sources are considered ideal systems for quantum cryptography applications [18]. Investigations on defects and their synthesis conditions are, therefore, essential for the understanding of these systems.
Synthesis
The effect of hydrogen on carbon nanotubes strongly depends on the temperature. Atomic hydrogen is always part of decomposing ethanol [84] at the synthesis conditions of carbon nanotubes (>750℃). A significant amount of atomic hydrogen atoms are generated at the decomposing steps [87] before splitting the C-C bond [86]. Hydrogen is known to help to heal sp³-defects [185] and is preserving the sp²-carbon lattice down until temperatures of 500-600℃.[19][186] Below this temperature, it is possible to hydrogenate arylic carbon systems until around 450℃ catalytically [187] but also desorption takes place. This leaves a small hydrogenation window at around 450℃, where the introduced chemisorption is kinetically stable on short exposures to the temperature. The direct generation of atomic hydrogen in plasma or with a hot tungsten wire would be more favorable.
Suspended carbon nanotubes were prepared using a typical ACCVD procedure with mixed molybdenum/cobalt catalyst on silicon wafers at 750℃ to study the effect of chemisorbed hydrogen. A mixture of 3% hydrogen in argon was introduced after synthesis during the rapid cooldown of the reaction chamber to ambient temperature. The synthesized nanotubes are then analyzed in air and compared to evenly prepared samples where a flow of 100% argon was used as a reference.
Intense Sidebands

Hydrogenation produces carbon nanotubes with an excitonic emission that is red-shifted to the usual vacuum level. The sideband shows polarisation dependence which proposes a phonon-assisted process.
The nanotubes show a moderately intense emission from their excitonic E₁₁ state that is red-shifted by 15-20meV compared to the average emission in a vacuum. As outlined above, the emission of excitons is sensitive to the dielectric surrounding. Statistical analysis confirms that the central emission energy is shifted for all nanotubes on the samples, regardless of chirality, which means that hydrogenation causes a fundamental change in the dielectric environment. The suspended nanotubes show a second peak slightly red-shifted to their E₁₁ level. The sideband also has the same polarization dependence as the main peak and nearly vanishes if the excitation polarization is rotated by more than 45° from the nanotube axis.
By studying a single nanotube spectrum, it is not evident if two peaks originate from two nanotubes with a similar diameter or if the peaks are an intrinsic feature of an unbundled, single nanotube. Such differentiation can be accomplished using statistical fluorescence spectroscopy [188]. The most promising technique to show if two bands always show up together is correlation spectroscopy. In NMR spectroscopy (COSY) it is typically used to identify spin coupled cross peaks[189][190]. The very same technique was shown to be useful for the analysis of large amounts of single nanotube spectra[191][192].

A contour plot of the symmetric spectral covariance for one sample shows mouse ear-shaped correlated peaks slightly red-shifted to the excitonic emission. Left: Silicon detector Right: InGaAs detector
For the relevance of this statistical analysis, I assume that bundles consisting of two different chiralities are equally distributed over all chiralities, and correlated bundling to a specific chirality is unlikely. In addition, the synthesized samples show large spacing between the positions of the nanotubes, which allows assuming that a significant amount of unbundled nanotubes exists in the measured data set. With these reasonable assumptions, the analysis clearly shows that every nanotube that is synthesized by the hydrogenation process shows sidebands. With this analysis, bundling can be excluded as the origin of these bands. The spectral autocorrelation also underlines the observed energy shift of the E₁₁ levels for all chiralities.
A disadvantage of correlation spectroscopy is that all peaks get weighted by their intensity, and spectra with close energies get merged. Although this can be overcome by measuring the spectral skew using the third momentum of the distribution[193], it is also evident that the direct analysis of every single spectrum using a peak fit is the preferred way. For this study, all spectra were analyzed by a custom multi-peak fitting routine to identify the intrinsic properties of every single nanotube without losing information by averaging before the analysis.

The correlated sideband shows a near-linear dependence on the energy of the bright exciton. The emission from the sideband shows an inverse quadratic dependence on the diameter of the nanotubes. The effect is found to be lower in air compared to experiments measured in vacuum by Nagatsu et al.[184].
Dark Excitons
The correlated side bands show shifts of 20-140meV. Within this vast range, various origins are possible. The polarization dependence suggests a phonon-assisted process, but a synthesis using ¹³C is needed to substantiate this finding further. While the HEM (G-Band) at 200meV and the defect band (D-Band) at 160meV [194] are too high in energy to be involved, a coupling to the RBM at 21meV would not explain the higher sidebands.
The lower K-phonon sideband (KPS) is located at 130meV [195] and is often discussed to be involved in the formation of defect bands in arylic and oxygen defects. Arylic sp³-defects on the sidewall of carbon nanotubes are known to form localized states at 150-266meV [196][197][198] below E₁₁ and chiralities with lower diameters show higher shifts than chiralities with higher diameters. Also, oxygen defects from UV/O₃ or milder oxidating agents like H₂O₂, or K₂CrO₄ can form similar defect bands at 100-200meV [199][149] and are also found to increase with the E₁₁ energy. Also, the cooling of defective nanotubes was shown to brighten the KPS [200].
Due to the enhanced spin-orbit coupling of these sp³-defects [47][201], a brightening of the dark exciton is usually discussed [184][200] as the origin of the bright KPS bands. A dependence on the inverse quadratic diameter should be visible, to substantiate this suggestion, which was theoretically predicted [3] for the bright-dark splitting using the Bethe-Salpeter equation. For carbon nanotubes in air, a fit to a/d² with a=30nm²meV was found to give decent chi-square values. This prefactor is in good agreement with the singlet-triplet splitting proposed by Capaz et al. for adsorbed dielectric environments of ε≈3. Nanotubes with a diameter of 1nm show this band at 40meV and nanotubes with a slightly lower diameter of 0.8nm show the band at 60meV. The nanotubes in this sample set are considered to be physisorbed with a water layer that sometimes desorbs due to laser heat. Acquisitions with the InGaAs detector typically take long exposure times, which is why almost no adsorbed states are observable in these PLE maps. The higher energy differences that presumably originate from the desorbed states show more agreement with the suggested curve that was found by Nagatsu et al. [184] for measurements in vacuum (ε≈1.8). The prefactor a is estimated to be even higher at around 85(4)nm²meV when accounting for the extension to smaller diameters in this study.
Conclusion
Hydrogenation causes a shift of the outer dielectric environment of the bright exciton. A brightening of dark triplet excitons from the enhanced spin-orbit interaction between sp² and sp³-carbon was found to give rise to a new emission pathway slightly red-shifted to the bright exciton by 20-140meV. The energy splitting intensifies for nano tubes with smaller diameters. The results are in good agreement with theoretical calculations and support other investigations on the topic eventually leading to better applications in spintronic devices.